Run SQL query
Overview
Kyligence test drive environment is already embedded with a SSB dataset. The SSB dataset is based on the TPC-H benchmark and contains five tables. For more information, see SSB sample dataset. We will run a sample SQL query to get the total revenues and supply costs of all products in all countries and regions within all these years.
SQL query
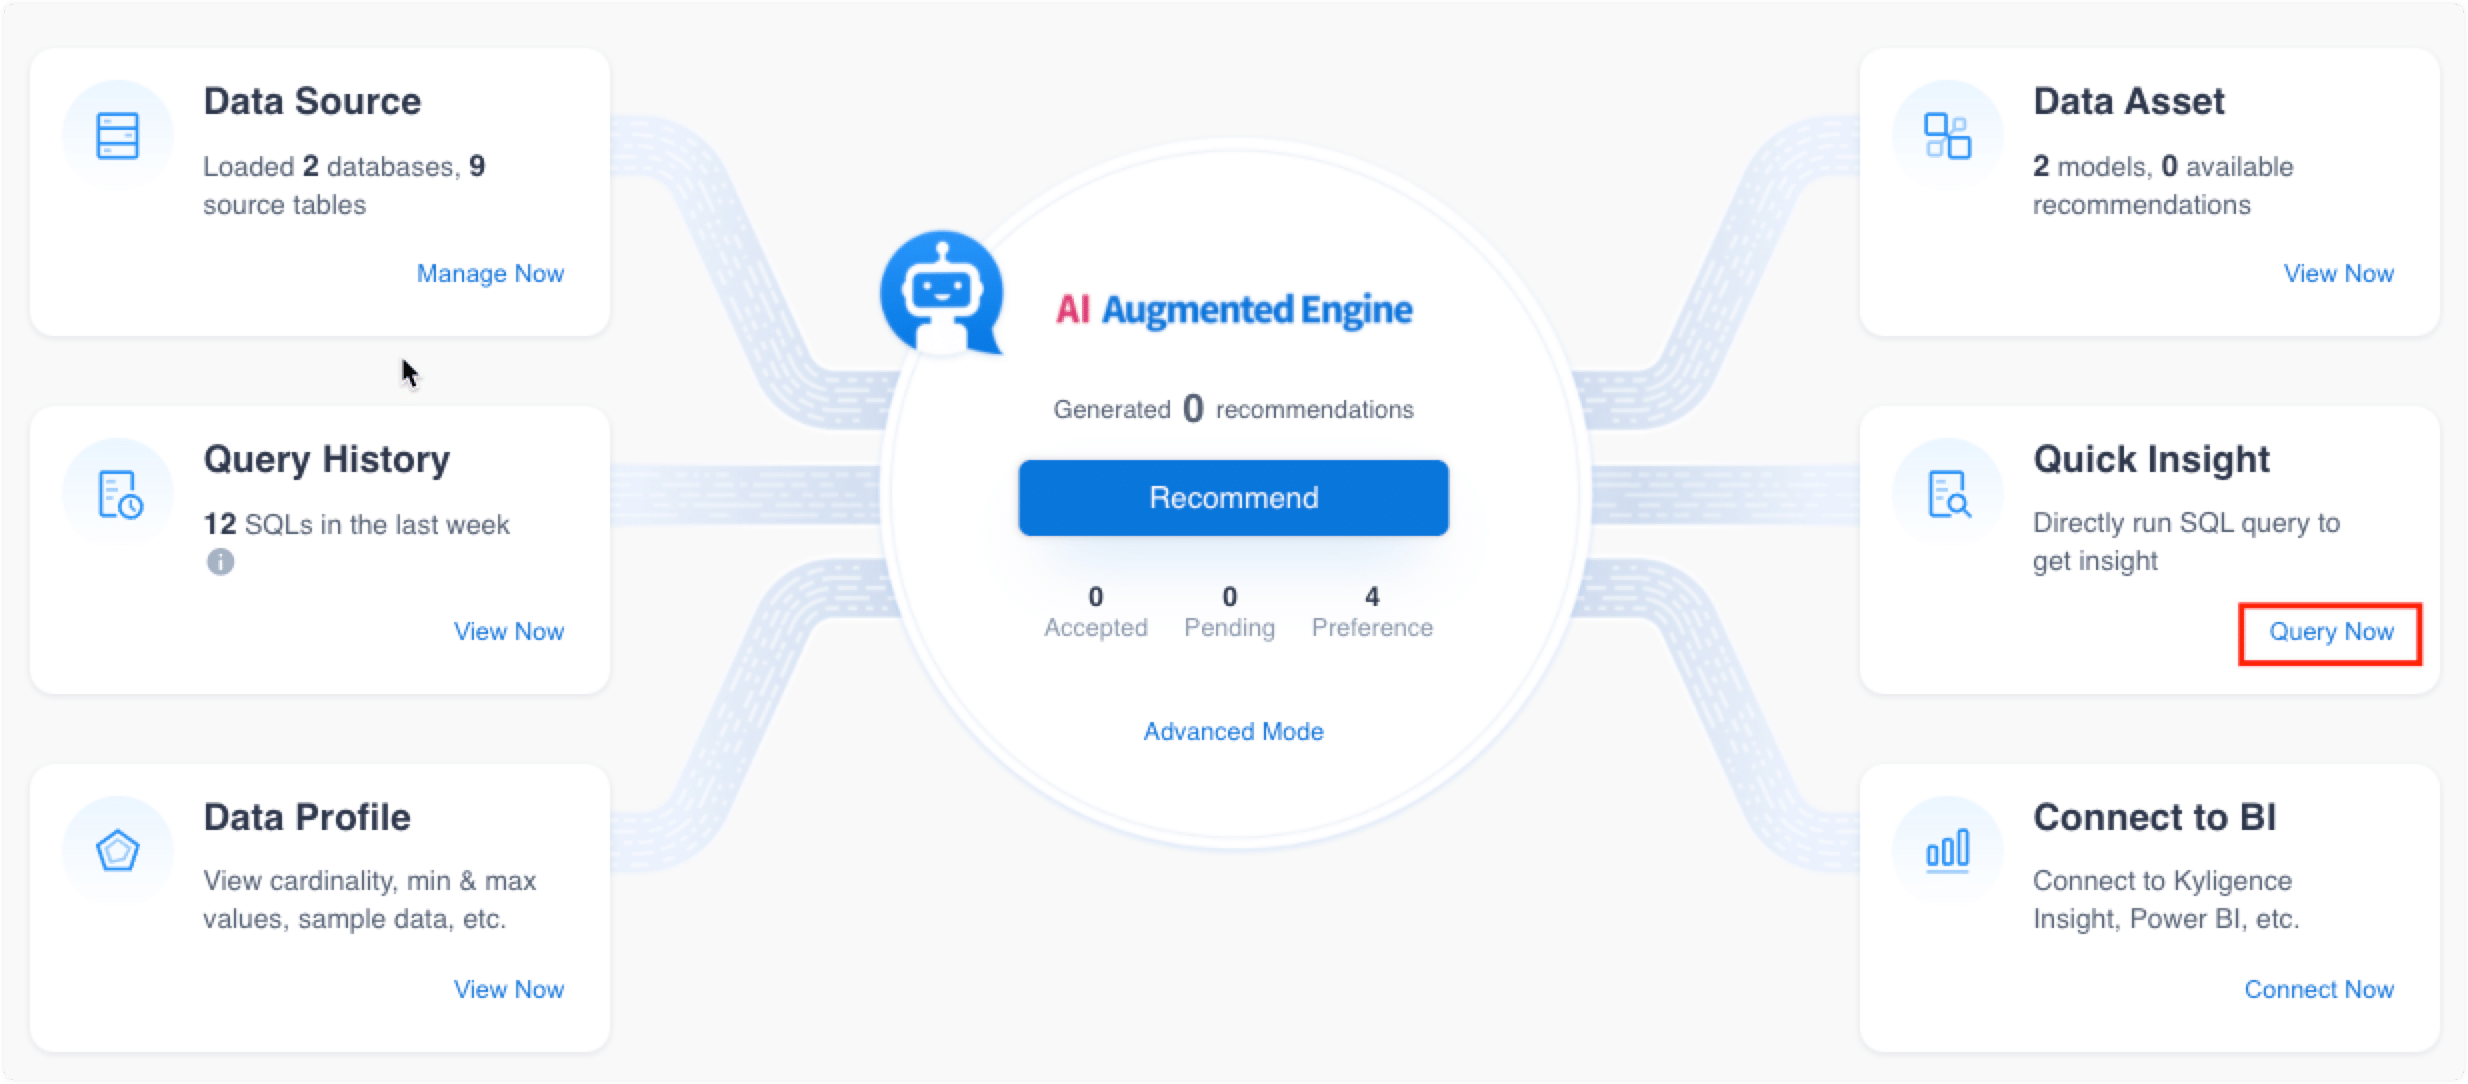
On the Home page, click Query Now under Quick Insight or on the left navigation panel, click Query.
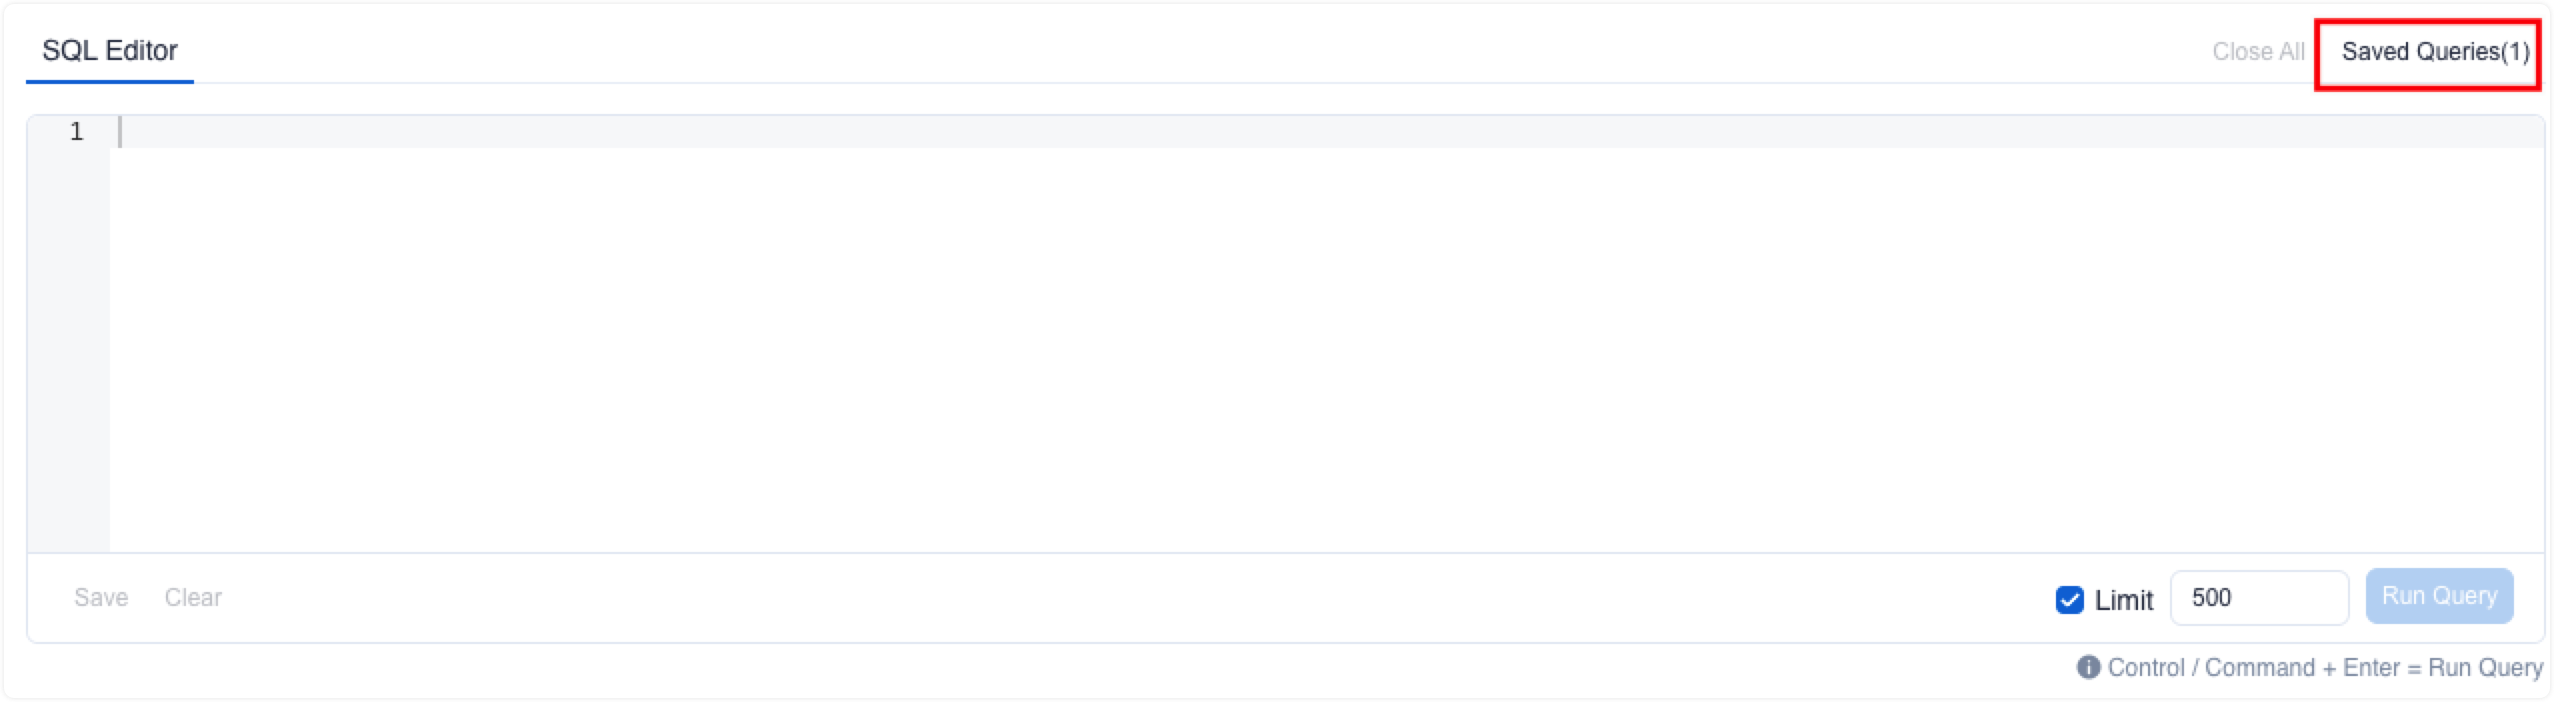
In the SQL Editor window, click the Saved Queries in the upper right corner to use a sample query for quick analysis.
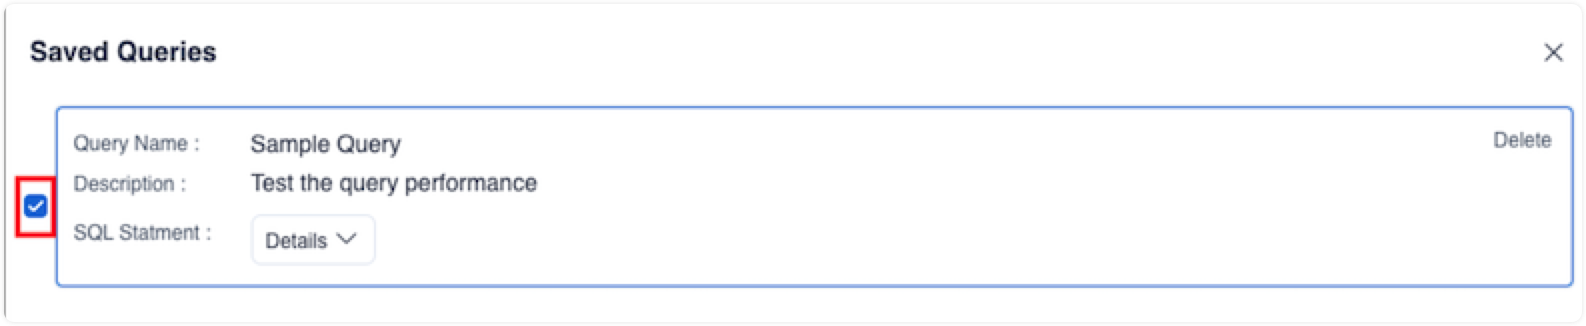
In the Saved Queries dialog box, select the Sample Query and click Run Query.
[!Note]
SQL commands used in this query:
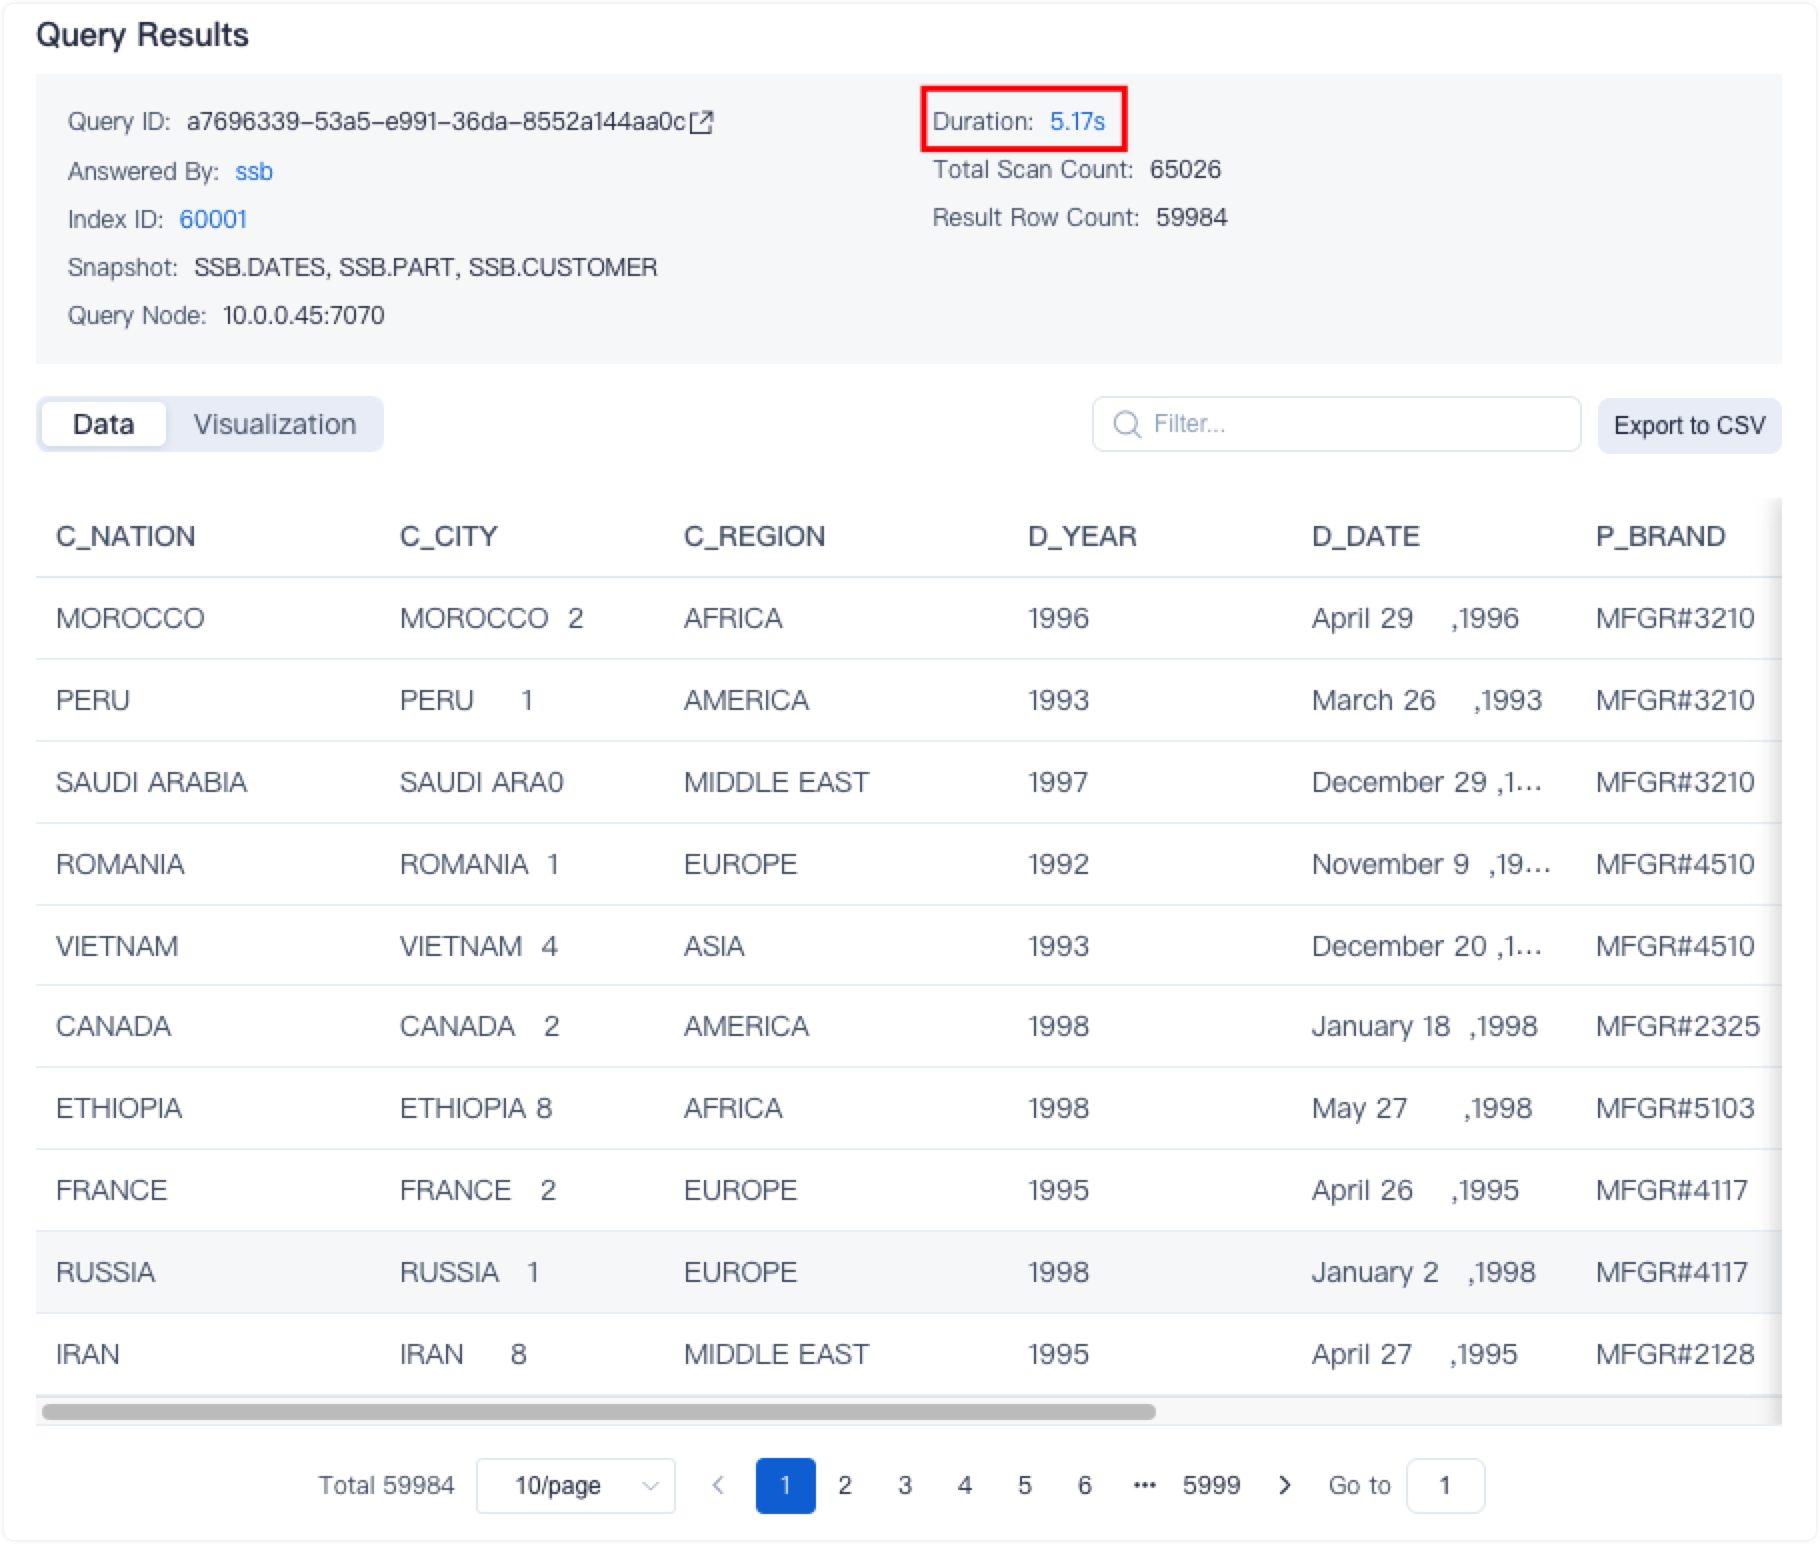
SELECT
CUSTOMER.C_NATION, CUSTOMER.C_CITY, CUSTOMER.C_REGION, DATES.D_YEAR, DATES.D_DATE, PART.P_BRAND
,sum(P_LINEORDER.LO_SUPPLYCOST), sum(P_LINEORDER.LO_REVENUE),count(1)
FROM
"SSB"."P_LINEORDER" as "P_LINEORDER"
LEFT JOIN "SSB"."CUSTOMER" as "CUSTOMER" ON "P_LINEORDER"."LO_CUSTKEY"="CUSTOMER"."C_CUSTKEY"
LEFT JOIN "SSB"."DATES" as "DATES" ON "P_LINEORDER"."LO_ORDERDATE"="DATES"."D_DATEKEY"
LEFT JOIN "SSB"."PART" as "PART" ON "P_LINEORDER"."LO_PARTKEY"="PART"."P_PARTKEY"
LEFT JOIN "SSB"."SUPPLIER" as "SUPPLIER" ON "P_LINEORDER"."LO_SUPPKEY"="SUPPLIER"."S_SUPPKEY"
group by CUSTOMER.C_NATION, CUSTOMER.C_CITY, CUSTOMER.C_REGION, DATES.D_YEAR, DATES.D_DATE, PART.P_BRAND;
After Kyligence finishes the query, it will return the results in the Query Results section, including the duration of the query. You can choose to view them in the form of Data or Visualization.
Next step: Build indexes based on recommendations